The engine already resolves a dependency graph and already lets any column be a function of other columns plus a random term, which is a structural causal model in everything but name. The Causal view is the interface for that — declaring a role wires the edges for you, and the panel shows the true, closed-form treatment effect a real estimator would have to recover from noisy data.
Declaring a model#
Open a table, switch to the Causal view, and click Declare a causal model. Two roles are required — Treatment and Outcome — plus a Direct effect, the coefficient of the edge between them. Everything else (confounders, mediators, colliders, instruments) is optional, and each one is a real column from this table, not a new synthetic node:
| Role | What declaring it wires | Needs its own variance? |
|---|---|---|
| Confounder | An edge into treatment and into outcome | Yes |
| Mediator | An edge from treatment and into outcome | No |
| Collider | An edge from treatment and from outcome | No |
| Instrument | An edge into treatment only | Yes |
You never draw an arrow yourself — declaring a confounder is what creates both of its edges, into treatment and into outcome, at the strengths you set.
Why a column needs a stated variance#
Treatment, confounders, and instruments each need a real, known variance for the ATE arithmetic
to be exact rather than simulated. Most numeric types state one — but a truncated
distribution's variance is not its family's own stated one (a normal cut at two standard
deviations has less spread than the untruncated family), so a treatment or confounder column
using a truncated distribution is refused with a real, specific validation error, not a silent
approximation. numeric.currency and numeric.percentage's own default examples are
untruncated and work directly; numeric.decimal's default example is truncated and will not
qualify for these two roles until its truncation is removed.
Reading the panel#
Once a model validates, the graph and the numbers both come from the engine's own
causal.truth() — nothing here is recomputed in the UI:
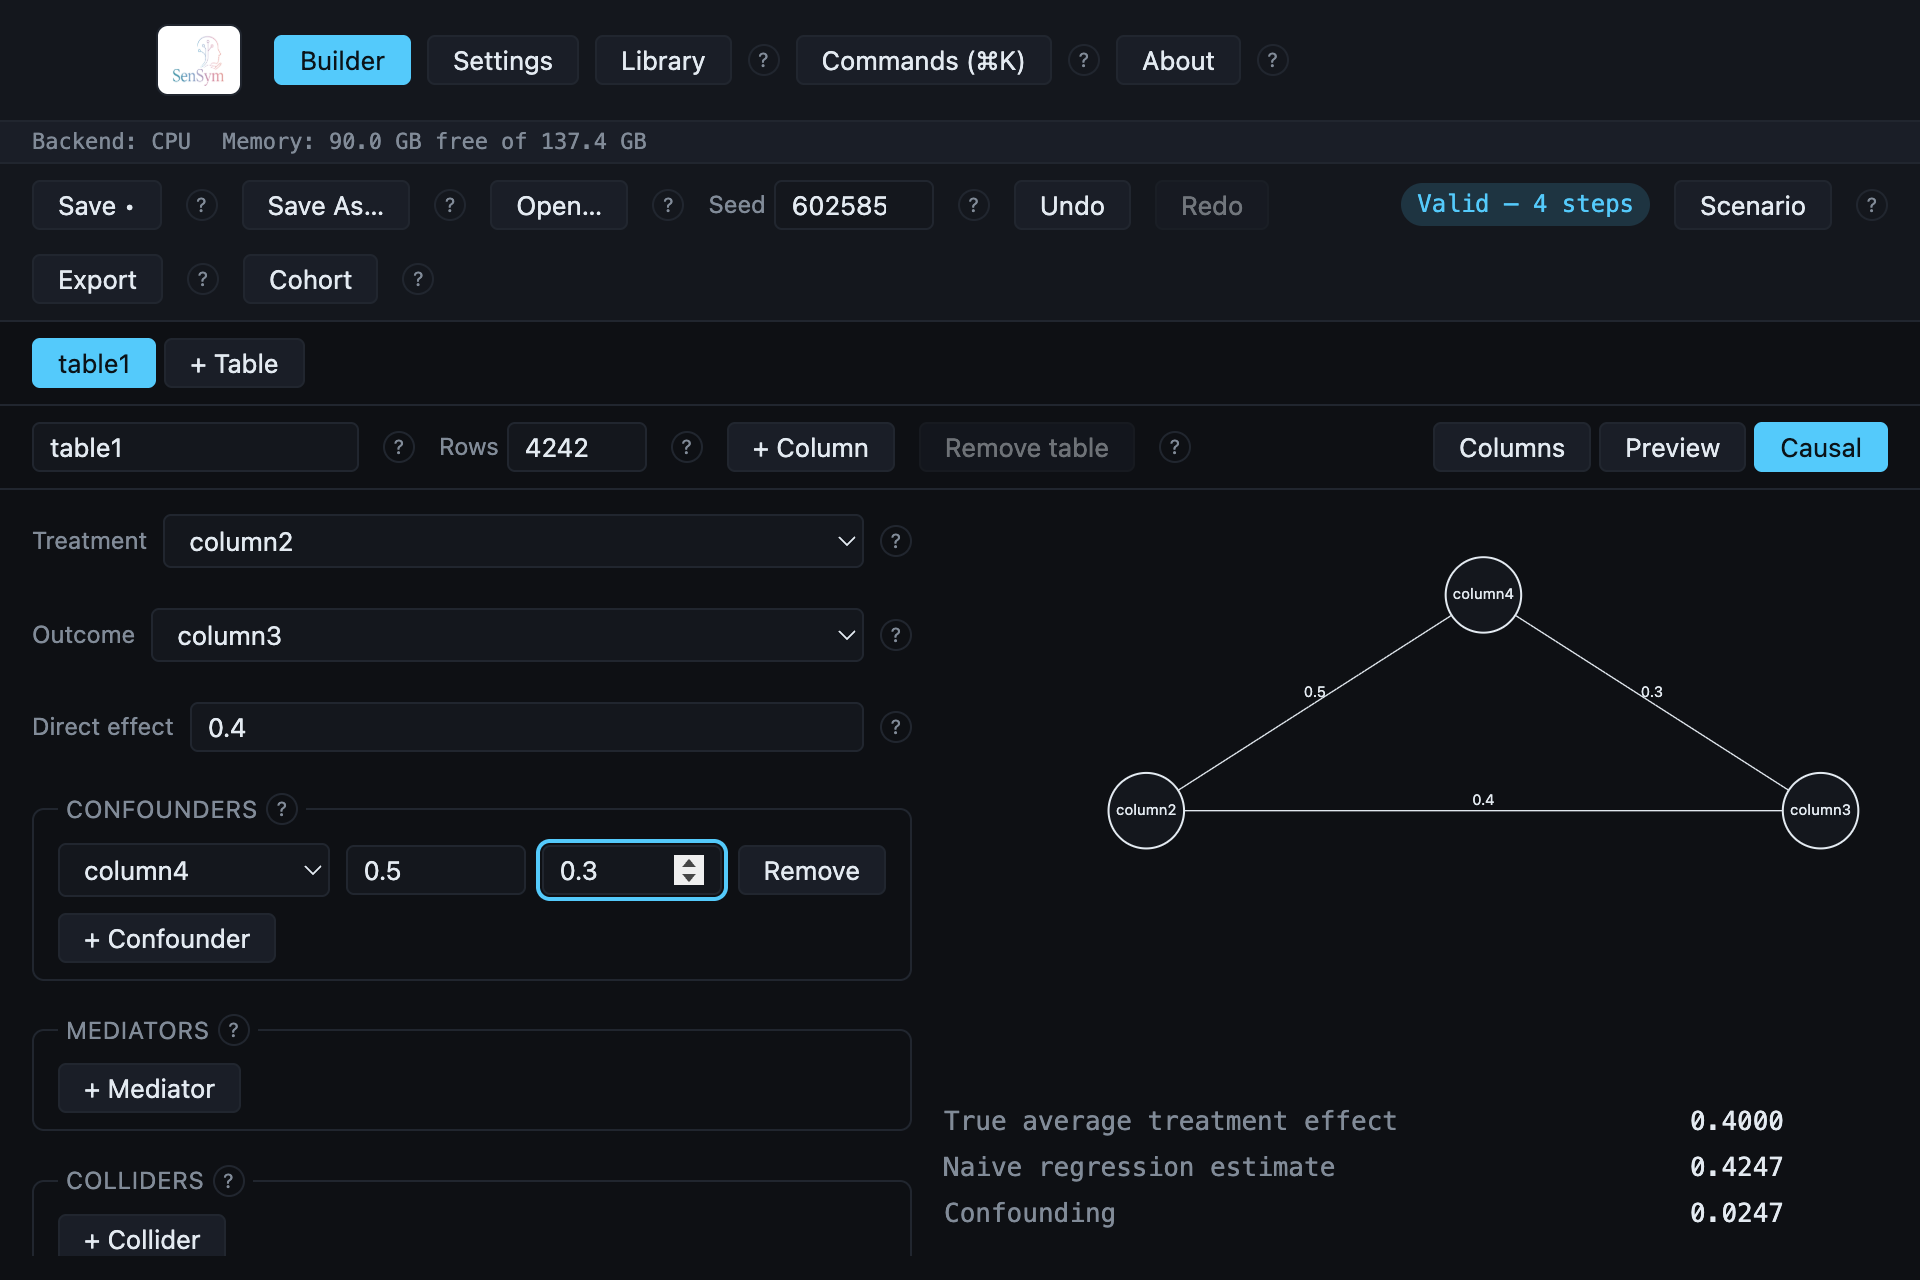
- True average treatment effect — the real coefficient you declared (
Direct effect, 0.4000 above), not an estimate. - Naive regression estimate — what a plain regression of outcome on treatment would report, confounding included (0.4247 above).
- Confounding — the gap between them (0.0247 above): exactly what the confounder's own
0.5/0.3coefficients and its variance predict, in closed form.
This is the number a downstream user's own naive analysis would get wrong, printed next to the number it should have gotten — the whole point of declaring the structure instead of leaving it implicit in a distribution nobody wrote down.